
Average Income Rose by $73,000 for Households in the Top 1%, Only $20 for Those in Bottom 90%
By Aviva Aron-Dine
Economists Thomas Piketty and Emmanuel Saez recently issued an updated version of their groundbreaking data series on income inequality in the United States. The data, which are based on Internal Revenue Service (IRS) files, are unique because they provide detailed information on income gains at the top of the income scale, extend back to 1913, and provide the first detailed look at the distribution of income in 2006.
The new data show:
-
Between 2005 and 2006, the average income (before taxes) of the top 1 percent of households increased by $73,000 (or 7 percent), after adjusting for inflation, while the average income of the bottom 90 percent of households increased by just $20 (or 0.1 percent). (In 2006, the top 1 percent of households were those with incomes above about $375,000.)
-
2006 marked the fourth straight year in which income gains at the top outpaced those among the rest of the population. Since 2002, the average income of the top 1 percent of households has risen 44 percent, or $335,000, after adjusting for inflation. The average income of the bottom 90 percent of households has risen about 3 percent, or about $1,000. (See Table 1.)
-
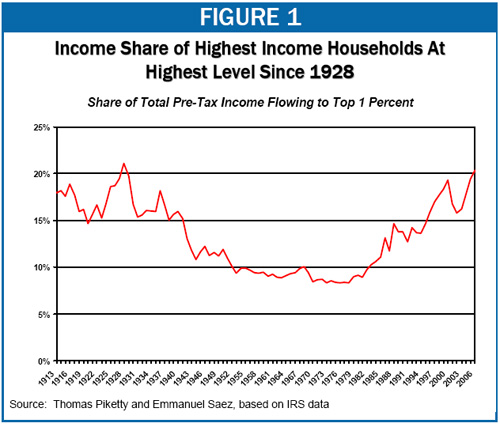
As a result, the share of the nation's income flowing to the top 1 percent has increased sharply, rising from 15.8 percent in 2002 to 20.3 percent in 2006. Not since 1928, just before the Great Depression, has the top 1 percent held such a large share of the nation's income. (See Figure 1.) In 2000, at the peak of the 1990s boom, the top 1 percent received 19.3 percent of total income in the nation.
- more -
Sphere: Related Content


No comments:
Post a Comment